Welcome to the Poverty Portal
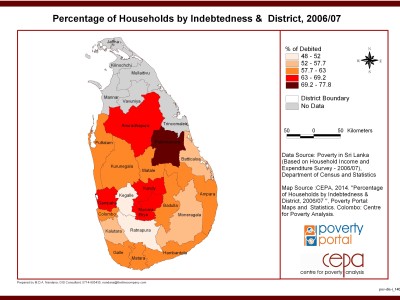
Percentage of Households by Indebtedness & District, 2006/07
This map shows the percentage of households by indebtedness and Districts between the year 2006-2007.
District | View More »
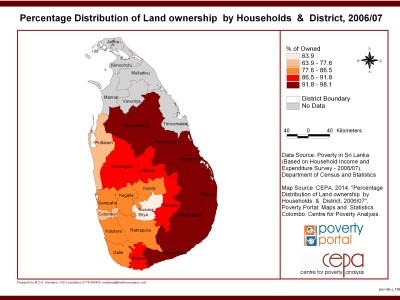
Percentage Distribution of Land ownership by Households & District, 2006/07
Show Percentage Distribution of Land ownership by Households & Districts, 2006/07
District | View More »
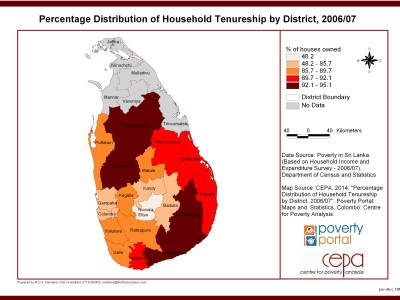
Percentage Distribution of Household Tenureship by District, 2006/07
This map shows the percentage distribution of household tenureship by Districts between the year 2006-2007.
District | View More »
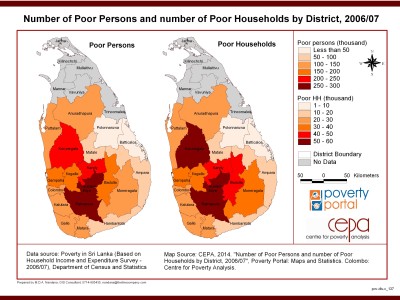
Number of Poor Persons and Number of Poor Households by District, 2006/07
This map shows the number of poor persons and the number of poor households by Districts between the year 2006-2007
District | View More »
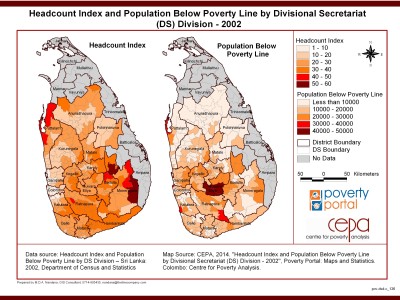
Headcount Index and Population Below Poverty Line by DS Division 2002
This map shows the headcount index and the population below poverty line be Divisional secretariats Division in the year 2002.
English | View More »
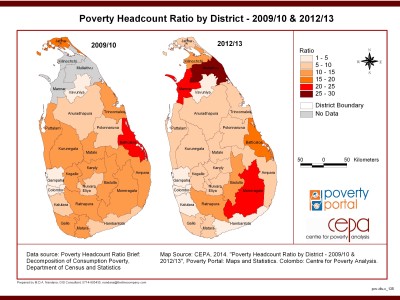
Poverty Headcount Ratio by District - 2009/10, 2012/13
This map shows the headcount ratio of poverty by Districts between the year 2009-2010 and 2012-2013.
District | View More »

Poverty Gap Index (%) by District, 2006/07 & 2009/10
This map shows the poverty gap index by Districts between the year 2006-2007 and 2009-2010.
District | View More »
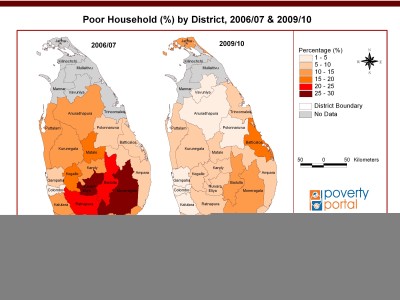
Poor Household (%) by District, 2006/07 & 2009/10
This map shows the poor household index by Districts between the year 2006-2007 and 2009-2010.
District | View More »
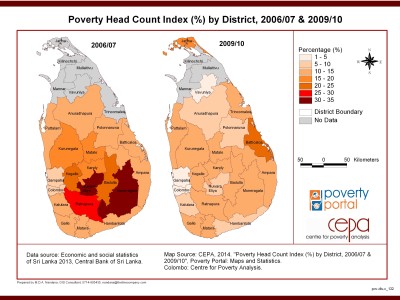
Poverty Head Count Index (%) by District, 2006/07 & 2009/10
This map shows the head count index of poverty by district between the year 2006-2007 and 2009-2010.
District | View More »
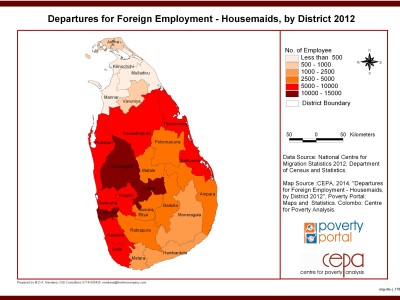
Departures for Foreign Employment - Housemaids, by District 2012
This map shows the number of people who left for foreign employment in the housemaid category by district in the year 2012
District | View More »
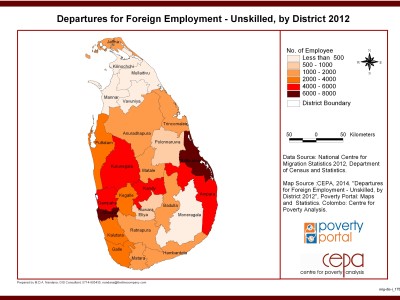
Departures for Foreign Employment - Unskilled, by District 2012
This map shows the number of people who left for foreign employment in the unskilled category by district in the year 2012
District | View More »
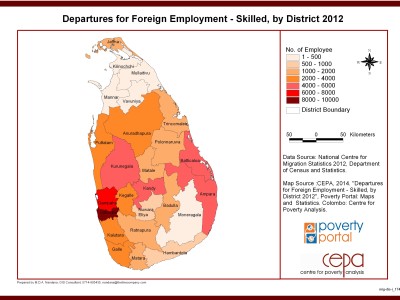
Departures for Foreign Employment - Skilled, by District 2012
This map shows the number of people who left for foreign employment in the skilled category by district in the year 2012
District | View More »
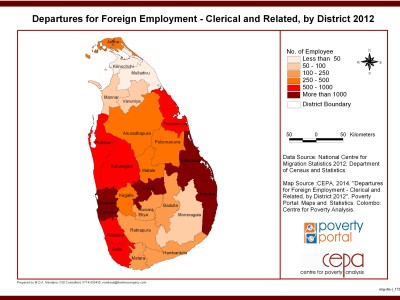
Departures for Foreign Employment - Clerical and Related, by District 2012
This map shows the number of people who left for foreign employment in the Clerical and Related skill category by district in the year 2012
District | View More »
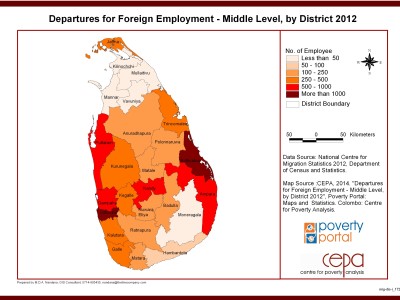
Departures for Foreign Employment - Middle Level, by District 2012
This map shows the number of people who left for foreign employment in the Mid-Level skilled category by district in the year 2012
District | View More »
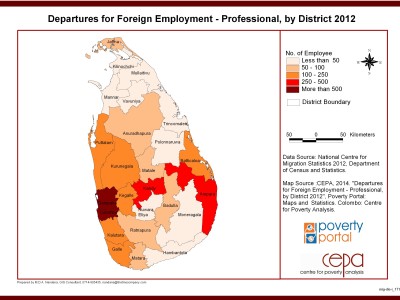
Departures for Foreign Employment - Professional, by District 2012
This map shows the number of people who left for foreign employment in the Professional skilled category by district in the year 2012
District | View More »
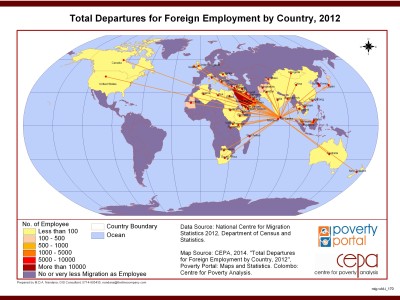
Total Departures for Foreign Employment by Country, 2012
This map shows the departures for foreign employment by destination country for the year 2012.
World | View More »
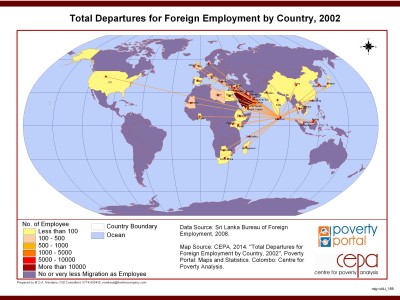
Total Departures for Foreign Employment by Country, 2002
This map shows the departures for foreign employment by destination country for the year 2002.
English | View More »
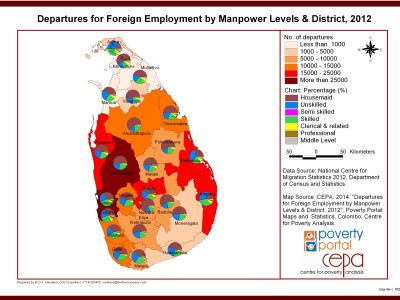
Departures for Foreign Employment by Manpower Levels & District, 2012
This map looks at the distribution of departures for foreign employment by District in the year 2012. The chart within each district compares the departures by skill category
District | View More »
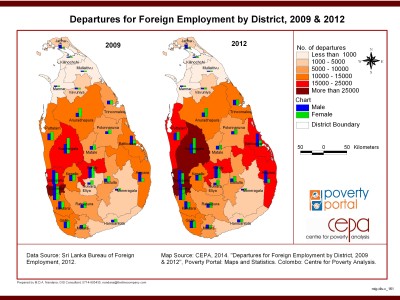
Departures for Foreign Employment by District, 2009 & 2012
This map compares the departures for foreign employment by District, for the years 2009 and 2012
District | View More »
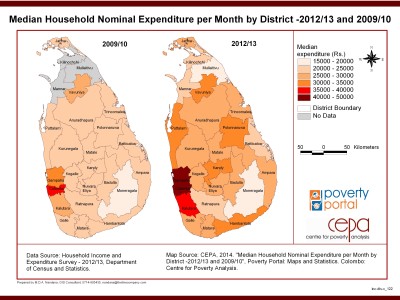
Median Household Nominal Expenditure per Month by District -2009/10 and 2012/13
This map shows the nominal expenditure per month of a median houshould by District between the year 2009-2010 and 2012-2013.
District | View More »