Welcome to the Poverty Portal
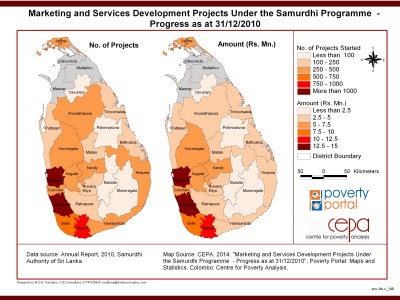
Marketing and Services Development Projects Under the Samurdhi Programme Progress as at 31/12/2010
This map shows the number of marketing and services development projects under the Samurdhi program as ar 31-12-2010.
English | View More »
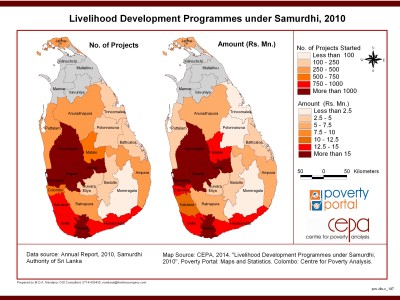
Livelihood Development Programmes under Samurdhi, 2010
This map shows the number of livelihood development projects that started and investment under the Samurdhi program in the year 2010.
District | View More »
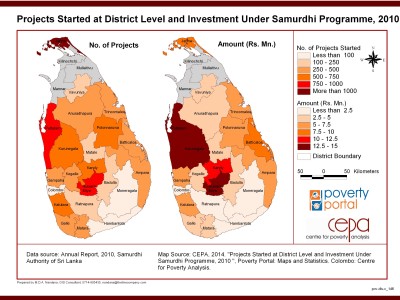
Projects Started at District Level and Investment under the Samurdhi Programme, 2010
This map shows the number of projects started at District level and investment under the Samurdhi program in the year 2010.
District | View More »
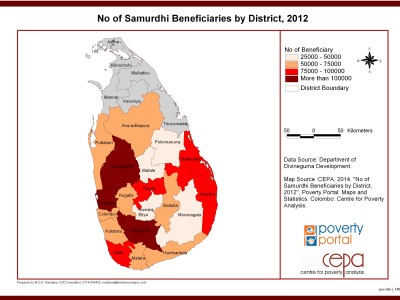
Number of Samurdhi Beneficiaries by District, 2012
This map shows the number of samurdhi beneficiaries by Districts in the year 2012.
District | View More »
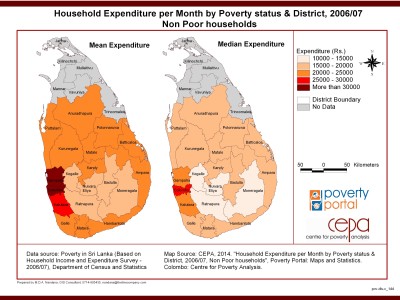
Household Expenditure per Month by Poverty Status & District, 2006/07 (Non-Poor Households)
This map shows the mean and meadian expenditure per month by poverty status and Districts of non poor households between the year 2006-2007.
District | View More »
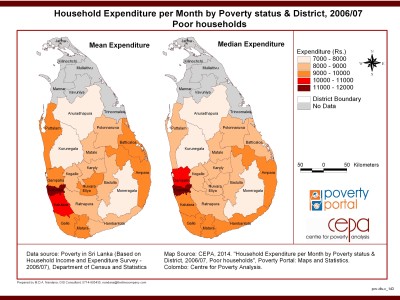
Household Expenditure per Month by Poverty Status & District, 2006/07 (Poor Households)
This map shows the mean and median expenditure per month by poverty status and Districts of poor households between the year 2006-2007.
District | View More »
Household Income per Month by Poverty Status & District, 2006/07 (Non-Poor Households)
This map shows the mean and meadian income per month by poverty staus and Districts of non poor houses between the year 2006-2007.
District | View More »
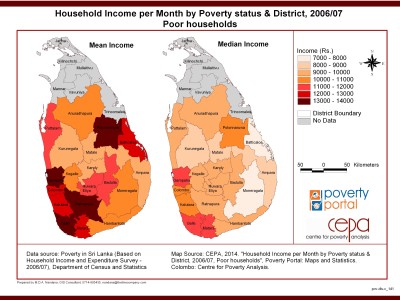
Household Income per Month by Poverty Status & Districts, 2006/07 (Poor households)
This map shows the mean and median income per month by poverty status and Districts of poor households between the year 2006-2007.
District | View More »
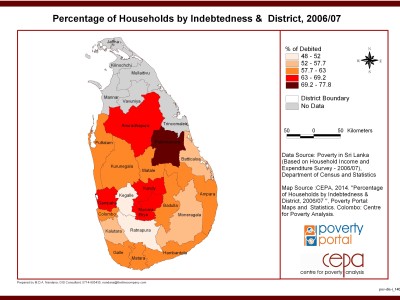
Percentage of Households by Indebtedness & District, 2006/07
This map shows the percentage of households by indebtedness and Districts between the year 2006-2007.
District | View More »
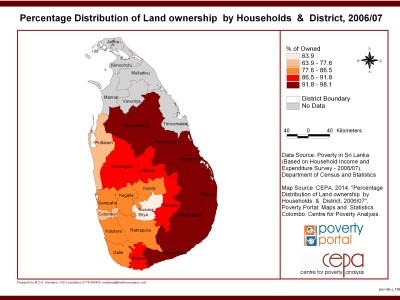
Percentage Distribution of Land ownership by Households & District, 2006/07
Show Percentage Distribution of Land ownership by Households & Districts, 2006/07
District | View More »
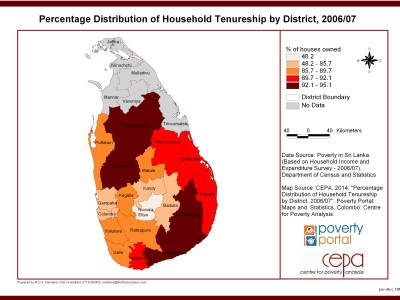
Percentage Distribution of Household Tenureship by District, 2006/07
This map shows the percentage distribution of household tenureship by Districts between the year 2006-2007.
District | View More »
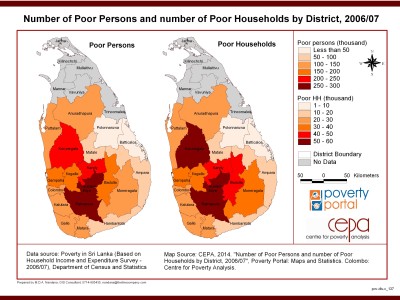
Number of Poor Persons and Number of Poor Households by District, 2006/07
This map shows the number of poor persons and the number of poor households by Districts between the year 2006-2007
District | View More »
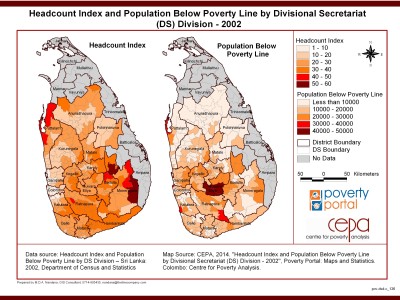
Headcount Index and Population Below Poverty Line by DS Division 2002
This map shows the headcount index and the population below poverty line be Divisional secretariats Division in the year 2002.
English | View More »
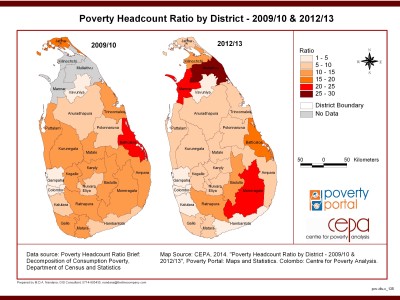
Poverty Headcount Ratio by District - 2009/10, 2012/13
This map shows the headcount ratio of poverty by Districts between the year 2009-2010 and 2012-2013.
District | View More »

Poverty Gap Index (%) by District, 2006/07 & 2009/10
This map shows the poverty gap index by Districts between the year 2006-2007 and 2009-2010.
District | View More »
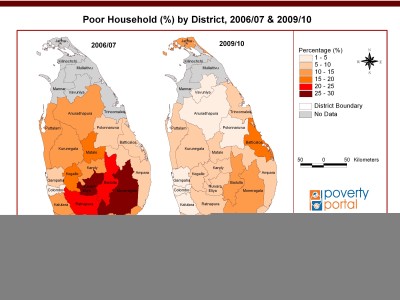
Poor Household (%) by District, 2006/07 & 2009/10
This map shows the poor household index by Districts between the year 2006-2007 and 2009-2010.
District | View More »
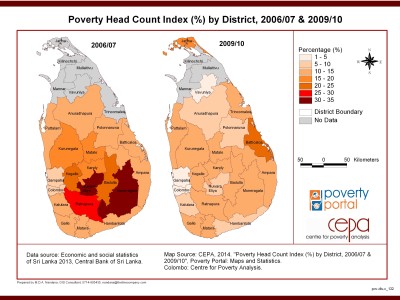
Poverty Head Count Index (%) by District, 2006/07 & 2009/10
This map shows the head count index of poverty by district between the year 2006-2007 and 2009-2010.
District | View More »